Do you wear 20 percent of your clothes 80 percent of the time?
How should you know? You may suspect that you do (or not), but odds are you do not keep track of it.
And why would you? Tracking your personal clothes usage is a time-consuming activity that would compete with everything else screaming for your attention on a daily basis. Plus, it’s easier not to think about it.
Perhaps that is why, when I looked for data to prove that we wear 80 percent of our clothes 20 percent of the time, I found… nothing! Seriously, nothing. There was not a single study nor data showing this to be true. At least I did not find it.
What I did find were countless articles and YouTube videos of people claiming this 80/20 clothing ratio to be true. To be fair, the points they were making, among other things, were:
- Our wardrobes are too big
- We spend too much money on clothes
- We do not wear the clothes that we have often enough (if at all)
- We can easily declutter our wardrobes
- And so on, and so forth…
So, on June 15, 2020 I took it upon myself to find out if I personally wear everything in my wardrobe at an 80/20 ratio. The motivation was driven by personal curiosity more than anything, and also out of frustration at not being able to find the information that I was looking for.
It has not been half a year since I started. I cannot believe how quickly time flies, but that is an article for another day. Also, does time actually fly? I have no idea, actually. For now, let’s just dig deeper into my results for 6 months from June 15, 2020 through December 14, 2019, shall we?!
How Does My 80/20 Wardrobe Experiment Work?
I have gone over this in much more detail in my previous monthly update articles. In particular, you can read the first article I wrote called Is the 80/20 Rule for Clothes Real (1-Month Self-Study) where I introduce the challenge setup and rules.
As a quick summary for those finding me for the first time, this is what I did:
- Collected all of my clothes
- Made an itemized list
- Put that list into an Excel spreadsheet
- Found my 80/20 number (20% was 19 items of my 96 articles in my wardrobe)
- Formatted the Excel spreadsheet with formulas
- Tracked the clothes I wore every single day
- Analyzed the results at the end of each month
- Published the results on my blog and YouTube channel
- Continued month after month
That’s it! The initial setup took a little time, but once it was ready my daily updates take no more than a minute or two to complete. The monthly analysis, article writing, and YouTube video making take a little more time, but should you be interested in doing a challenge like this for yourself you can skip this part and just do the setup and daily inputting.
I Made a Mistake: The Case of the Missing Gloves
When I started this self-experiment on June 15, 2019, I found everything that I owned and itemized it with great care to ensure the honesty and accuracy of this study. On top of that, errors would be catastrophic to my monthly publishing schedule.
Imagine that tomorrow I find a box of T-shirts that I forgot about. I would, ethically, have to add them back to the very beginning of my analysis, recalculate all of the results for each month, and then amend the erroneous results in my blog posts and YouTube videos.
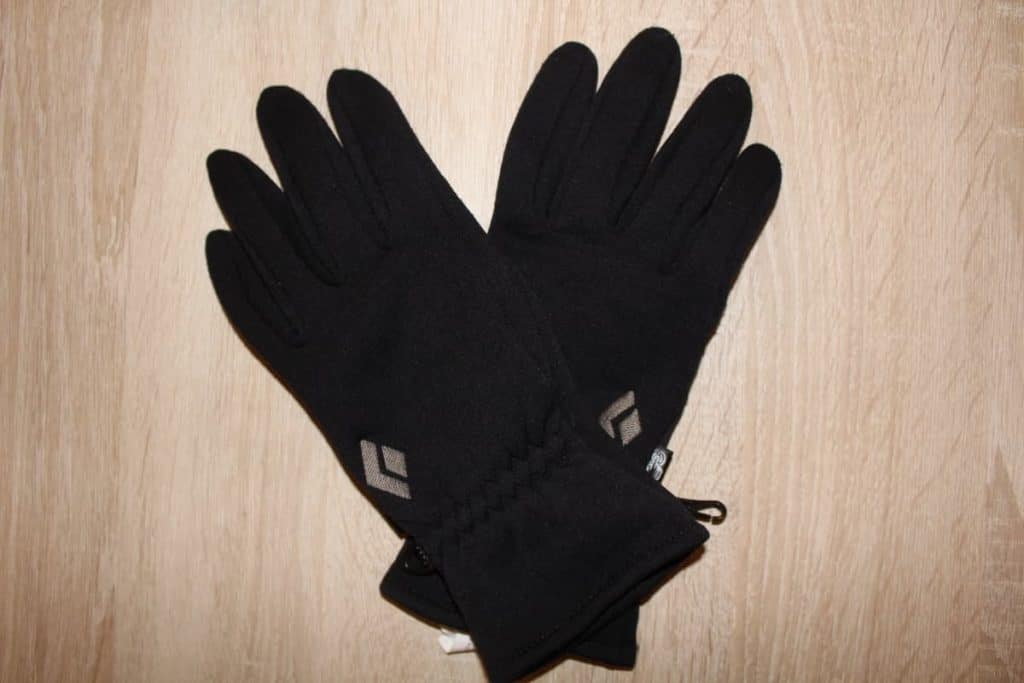
Well… as it turns out, I did make a mistake! As I was digging through some storage boxes, I found my pair of gloves!

I am very fortunate that it was only one extra item to add to my inventory and analysis. Let’s check out some numbers to find out why:
- Original Inventory Total = 96 items
- Original 20% of Inventory = 19.2 items
- Original 20% of Inventory (rounded for simplicity) = 19 items
- Updated Inventory Total = 97 items
- Updated 20% of Inventory = 19.4 items
- Updated 20 % of Inventory (rounded for simplicity) = 19 items
As you can see, despite finding my pair of gloves, I am still only counting the top 19 articles in my wardrobe towards my final 80/20 number results. Fortunately for me, the published 80/20 monthly results do not change thanks to the rules of rounding up and down. Thank goodness for that!
Now, the Total Percent of Wardrobe Worn Number did need to be slightly adjusted, but the change was small and easy to make. The numbers I will present to you momentarily reflect my best effort to be honest and accurate, and they are as updated as I could possibly make them.
What Are the Results After Six Months?
Wow! Six months is a long time! Summer and fall have come and gone, and winter is now upon us. It also means that the results of this study now represent essentially two full seasons of the year, one hot and one colder. The results should represent a solid sampling of my entire wardrobe.
Let’s see how I did:
My 80/20 Rule Number for Each Individual Month:
| Month | 1 | 2 | 3 | 4 | 5 | 6 |
| Individual Month | 70.21% | 67.83% | 66.67% | 62.56% | 68.16% | 71.60% |
My 80/20 Rule Number for Each Cumulative Month:
| Months | 1 | 1-2 | 1-3 | 1-4 | 1-5 | 1-6 |
| Cumulative Months | 70.21% | 64.52% | 63.34% | 60.13% | 59.63% | 60.75% |
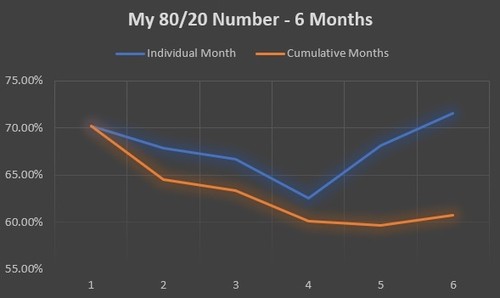
Graph of Above Data:

So, over the course of six months, I wore 20% of my wardrobe 60.75% of the time!
This marks a first during the course of my challenge. It is the first time that my cumulative 80/20 number has risen month-over-month. For the first 5 months, the cumulative 80/20 number decreased every month. From the 5th month to the 6th month, it rose from 59.63% to 60.75%, respectively. You can see that in the orange line above, and also in the numerical graph.
You can see in the charts and in the graph that there is much more volatility on a smaller sample size (one month) than with a larger sample size (six months). As you can see in the blue line above, the number jumps down and up more extremely.
That makes sense. When it’s only hot I wear the same things all the time. When it is only cold the same applies. When the weather is changing, I also add more variety to what I wear.
As I have now experienced one hot and one cold season, my suspicion is that my current six-month 80/20 number of 60.75% will be a good guestimate of my eventual final 80/20 number. We shall see…
The Percent of My Total Wardrobe Worn for Each Individual Month:
| Month | 1 | 2 | 3 | 4 | 5 | 6 |
| Individual Month | 53.61% | 54.64% | 56.70% | 68.04% | 60.82% | 65.98% |
The Percent of My Total Wardrobe Worn for Each Cumulative Month:
| Months | 1 | 1-2 | 1-3 | 1-4 | 1-5 | 1-6 |
| Cumulative Months | 53.61% | 61.86% | 71.13% | 77.32% | 80.41% | 84.54% |
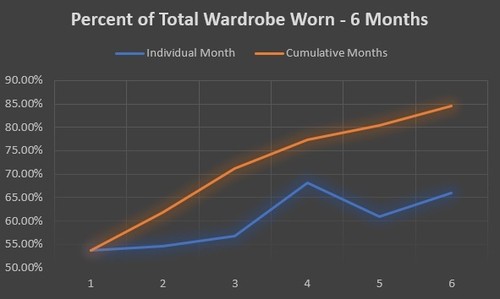
Graph of Above Data:

After six months, I have used 84.54% of my entire wardrobe!
That’s actually pretty awesome, and I am quite pleased with this. There are only 15 articles that I have not worn, and many of those are accessories or specialty items (like my water resistant, long-sleeved, water sport shirt) which I truly hope to use again moving forward.
There were three pairs of socks that have gone unused, and considering that I already have a surplus of socks, they will get purged sooner or later. Nice to know that I can purge with confidence as the data supports it, haha.
Here is the actual document I used for my challenge. See how I organized it, see what I own, see what I own, see how often I wore everything (no judging, please!), and check the results to verify what I have presented here.
My Top 19 Articles Used Over Six Months! (An Ode to My Belt)
Curious about what my Top 19 articles of clothing are?!? So am I!!!
According to the data, I wear the following 20% of my wardrobe 60.75% of the time:
| Rank | Item | # of Days Used over 183 Days | % Usage Over 6 Months (total wardrobe) |
| 1 | Accessory: Belt | 161 | 7.14% |
| 2 | Shoes: Blue Flip Flops | 143 | 6.34% |
| 3 | Shorts: Gym Shorts | 130 | 5.76% |
| 4 | Pants: Pyjamas | 127 | 5.63% |
| 5 | Shoes: Sneakers | 92 | 4.08% |
| 6 | Sweater: Grey Hoodie | 82 | 3.64% |
| 7 | T-Shirt: Gym T-Shirt | 80 | 3.55% |
| 8 | Jacket: Winter | 64 | 2.84% |
| 9 | Shoes: Green Flip Flops | 61 | 2.71% |
| 10 | Pants: Jeans #2 | 58 | 2.57% |
| 11 | Sweater: Blue Hoodie | 56 | 2.48% |
| 12 | Sweater: Thermal | 48 | 2.13% |
| 13 | Pants: Jeans #1 | 47 | 2.08% |
| 14 | Shoes: Blue Vans | 42 | 1.86% |
| 15 | T-Shirt: Got EBITDA? | 42 | 1.86% |
| 16 | Pants: Red | 37 | 1.64% |
| 17 | Shoes: Multicolored Vans | 35 | 1.55% |
| 18 | Underpants: Barcode Style | 34 | 1.51% |
| 19 | T-Shirt: Superman | 31 | 1.37% |

So there you have it. It seems that my belt is the most important article of clothing that I own considering how often I wear it.
With how much weight I have lost over the years, I’m glad to finally have some evidence to show how good a job my belt is doing of keeping my pants from falling down to the floor on a daily basis.
Plus, without my belt I would probably have to actually buy smaller pants. Buying stuff costs money. I’m trying to avoid that. Therefore, my belt becomes all the more invaluable to me!
Winter is Here: Seeing a New Trend
It became much colder between November 15 and December 14, as it did with most places in the northern hemisphere. Winter is no longer coming… it is here.
While I normally have a high tolerance and resistance to the cold, there were some especially frigid mornings here in the Netherlands. As a result, I started using my hat for the first time, and its use grew in frequency as the month-long challenge period progressed.
I also wore my thermal underpants for the first time since I started keeping track of my daily clothes usage. It’s funny to think, but there was a time when I lived in La Paz, Bolivia, and it was so cold there that I wore my thermals every single day. Now, they are reserved for only the most extreme of days in the Netherlands.
It just goes to show that our wardrobe needs change dramatically depending on where we live and the time of the year. If you own a home, are settled, and do not travel much, I bet you already have everything you need for every conceivable situation. If you travel often, on the other hand, you may need extra outfits or specialty items that get used infrequently.
What Does My 80/20 Number Mean?
It means that even though my wardrobe is relatively small at only 97 articles of clothing, I still wear a disproportionately small number of items more frequently than everything else.
This makes sense. We all have our favorite T-shirts, pyjamas, shoes, socks, sweaters, etc. and we tend to wear them more often despite other options having been bought, paid for, and still available in our closets.
I am NOT proposing that we wear everything we own in an equally distributed fashion… that would be ridiculous. I’m simply showing that the numbers support the idea that some of our wardrobe is more important than the majority of the rest.
This becomes even more exaggerated the more articles of clothing and accessories that you have. If I suddenly added 50 more items to my wardrobe, I would probably still wear the same few items (probably the exact same things I have been wearing because I like them so much), thus turning my 80/20 number from 60.75% to something closer to 80%.
My hope with all of this is to show that less is more, and that the next time you think you need to go and buy more clothes, you might second guess yourself and realize that you already have everything you need.
Save your money and invest in yourself in another way.
Looking Ahead to Month 7: Christmas and Birthday Presents?!?
Christmas is, among other things, a time of giving. For some, the combination of socks and jocks (underpants) works just fine. In fact, I LOVE getting new socks and underpants and not having to pay for them!
Couple that with the fact that my birthday is on December 26, and you can imagine that I have gotten my fair share of funny socks, clean underpants, and ties over the years.
While I normally accept them graciously, this year is a bit different. Getting more socks and underpants could cause a hiccup in my 80/20 Wardrobe experiment! If I receive one more article of clothing, then 20% of my wardrobe will jump from 19 articles to 20 articles.
Should that happen, I am not entirely sure how I will handle it. As an old mentor used to say to me, “Don’t worry about things that haven’t happened yet.” It is wise advice… still… I cannot help but wonder what the holiday and birthday season will have in store, and how I might adapt to any thoughtful and generous clothing gifts that may be in store for me.
“We’ll see.”, said the wise man…
Jack Clancy YouTube Channel
As well as my website, I also have my Jack Clancy YouTube Channel! Check out the YouTube video I made for this update:
Would You Like to Try this is 2020?
The New Years is a time for new beginnings. It is a time for reflecting. My hope for you going into 2020 is that you will have an amazing year and continue working towards becoming the person you wish to be.
If the person you wish to be is someone who is in control of their personal finances, and if you are tired of spending so much money on clothes, then you might like to try this experiment out for yourself. Here is a link to a template you can have and use to begin your very own 80/20 Wardrobe Self-Study Experiment in 2020 and beyond.
Feel free to adapt the template as best works for you. Reach out to me on my contact form if you need any help setting up this experiment. I would be more than happy to talk to you about it and get you started.

