It is hard to believe that over five months have passed since I started tracking my clothes usage every day. Time flies, and it seems to be speeding up as I get older… but that is an article for another day.
The good news is that I now have data to present on my wardrobe’s 80/20 number for the first five months of my year-long experiment!
What Is My 80/20 Wardrobe Experiment?
For those of you finding my study for the first time, I am attempting to determine how often I wear the most frequently worn 20% of my wardrobe over the course of a full year.
It all started when I was curiously looking into the Pareto Principle, also known as the 80/20 Rule. For those unfamiliar with this concept, it claims that 80% of our results come from 20% of our effort. It’s a fantastically useful principle which shows up often in our lives, whether we realize it or not.
In fact, I repeatedly read that we wear 20% of our clothes 80% of the time. I read it so often that I just assumed it was true.
Then, I looked for data to prove it. As you might expect, I found nothing. The only things I found were claims by people seeking to make the point that we spend too much money on clothes and that our wardrobes are too large for our needs.
Now, I do agree with these statements, but I still wanted to know if the numbers added up.
So, being the curious, stubborn, and long-term thinking fellow that I am, I decided that I would be the one to get some hard data on this claim and share it with the world!
How Does My 80/20 Wardrobe Experiment Work?
There was quite a bit of work to set it all up. I had to:
- find every article of clothing, accessory, and pair of shoes that I own
- itemize all of it into categories (shirts, pants, etc…)
- create an Excel spreadsheet system to track all of this
- format the Excel spreadsheet with formulas to calculate the data
- input all of this information into my Excel spreadsheet
- calculate and analyze the results
- publish the results on this blog and on my YouTube channel… each month!
In fairness, this experiment is actually quite easy to manage once it is all set up. I just put an “x” into the Excel spreadsheet for the item of clothing, accessory, and pair of shoes that I wear each day. That’s it. The formulas do most of the rest of the work.
I just go in at the end of each month, check the data, make it look presentable, and publish the updated monthly results. Anyone can do this, and it’s pretty fun and interesting to see my patterns of behavior are laid out for me in tables and charts. At least, I think it is pretty fun and interesting : )
What Are the Results After Five Months?
I decided to do this experiment for a full year because I felt that anything less would not be a fair representation of my entire wardrobe throughout all of the different seasons and weathers that a typical year has to offer.
My wardrobe clearly has clothes for all of the seasons, so to give them all an equal opportunity to be worn, this experiment had to be a year long… if not longer.
The first five months are now complete. That is almost half of a year. That is almost two full seasons. While still incomplete, I feel that I am beginning to see more meaningful data.
Keep in mind that I have a total of 96 articles of clothing, accessories, and pairs of shoes. That means that I calculated the percent for the top 19 articles of clothing that I wore each month, and for each set of collective months.
My 80/20 Rule Number for Each Individual Month:
| Month | 1 | 2 | 3 | 4 | 5 |
| Individual Month | 70.21% | 67.83% | 66.67% | 62.56% | 68.16% |
My 80/20 Rule Number for Each Cumulative Month:
| Month | 1 | 1-2 | 1-3 | 1-4 | 1-5 |
| Cumulative Months | 70.21% | 64.52% | 63.34% | 60.13% | 59.63% |
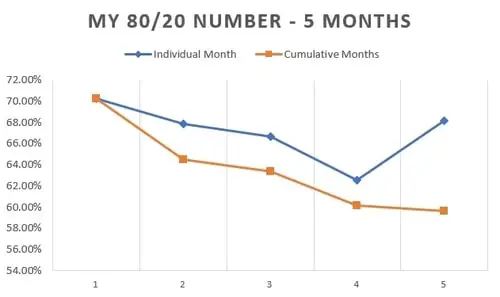
This is what all of these numbers looks like in a graph:

So, over the course of five months, I wore 20% of my wardrobe 59.63% of the time!
My personal 80/20 number has decreased each and every month since I started collecting data. That was, I figured, to be expected. As the months and seasons change, so does my need to wear different articles of clothing. I no longer wear my warm-weather clothes, just like I did not wear my winter jacket in the summer.
On an individual month basis, for the 5th month alone I wore 20% of my clothes 68.16% of the time. It’s an increase from the downward trend presented in the first four months, but it was also to be expected: there should be more variance in a smaller sample size of one month compared to a bigger sample size of five months.
I also collected data on the percent of my total wardrobe worn on an individual month and cumulative months basis. Here is that data:
The Percent of My Total Wardrobe Worn for Each Individual Month:
| Month | 1 | 2 | 3 | 4 | 5 |
| Individual Month | 54.17% | 55.21% | 57.29% | 68.75% | 61.46% |
The Percent of My Total Wardrobe Worn for Each Cumulative Month:
| Month | 1 | 1-2 | 1-3 | 1-4 | 1-5 |
| Cumulative Months | 54.17% | 62.50% | 71.88% | 78.13% | 81.25% |
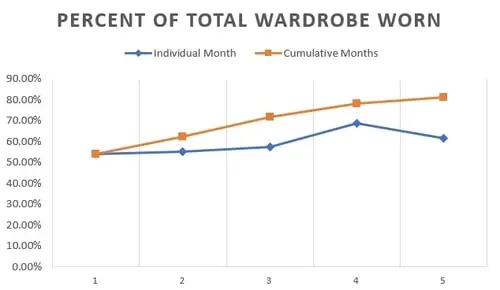
Check out this graph to quickly see how these numbers have changed over time:

After five months, I have used 81.25% of my entire wardrobe!
This was also to be expected, the percent of my total wardrobe over time has increased every month since I started. I need different things with different weather, my tastes change, and I get inspired to spice it up by wearing new things from my wardrobe every now and then.
On an individual month basis, you can see that months 4 and 5 had the highest percentage of my total wardrobe worn. That’s most likely because I need to wear more clothes to stay warm during colder periods of the year. In the warmer-weather months, less-is-more it would seem.
What Does My 80/20 Number Mean?
Very directly, it means that I wear the top 19 articles of clothing I own (that’s 20% of my total wardrobe) 59.63% of the time. That’s not 80/20, but it is still a disproportionately frequent amount of time to be wearing the same things over and over again.
Many of my top 19 articles are shoes, which means that I am wearing most of my shoes and that they are a critical part of my wardrobe.
Only one pair of underpants cracked the Top 19, which is good. It means I am rotating them at an appropriate frequency : )
Not a single pair of socks made it into the Top 19. This is because of all of the categories of clothes that I have, I quite frankly have too many socks. This lets me know, mathematically, that I can cut back on socks and still be totally fine.
Things you can imagine wearing frequently, like a belt, the same pyjamas you wear every night, the same gym stuff you wear all the time, are also very high on my list.
YouTube Video
If you would like to hear this information straight from the horse’s mouth, I would love for you to watch my accompanying YouTube video. It’s fun to write about this experiment, and it’s also fun to talk about it.
Feel Like Experimenting?
If you are still reading this article, I salute your curiosity, scientific mind, and willingness to see thing through to the end. Perhaps you might also like to try this experiment out for yourself?
If so, I made a template based on the same Excel spreadsheet that I use to calculate my results. You can download it here:
If you have any questions or need help getting started, reach out and let me know. I would be thrilled to help you!
REMEMBER: You do not need to do this experiment for an entire year. If you are just curious about your 80/20 number, you could try it for a week, or a month… whatever works best for you and your curious mind.

How About a Secret Experiment?!?
Are you concerned that one of your loved ones is spending too much money on their wardrobe while piles of clothes lay unused and unloved? Try doing this experiment SECRETELY on them!!! Itemize their wardrobe, and track their clothes usage to the best of your ability. Then, present them with the (probably shocking) results!
Depending on the intimacy of your relationships, underpants may be difficult to track. They can be ignored and your experiment will still have its intended results… I assure you : )
Disclaimer: Doing this may be a bad idea. Experiment with your friends and loved ones at your own risk!!!

